GreenPlotter
Toward an Automated System for Green Urban Development
Urbanization & Ecological Challenges
Urbanization needs land,
Land normally should be cut and divided for road and construction.
- Results?
Environment degradation, especially deforestation,
- What should we do?
As a designer, suggest less destructive design
- What urban development planning needs?
Experts in different fields, Plenty of parameters, Data collection, regulatory requirements, environmental and community considerations, technical complexities, and balancing multiple stakeholder interests, … and time.
Aim of study
Using AI to minimize the environmental impact of the built environment on the natural environment
Question of study
What are the criteria of urban development and how we can parameterize and then computerize this process?
How can AI streamline the urban development process?
How to quantify a green parameter into the process of urban development.
STEP 1: Problem statement
STEP 2 Literature review of similar studies, identifying the methodology, parameters, and AI tools they use to divide and develop the lands.
STEP 3 Identifying a measurable green factor related to urban green areas that we could incorporate into the process of digital land development
STEP 4 Introducing our methodology and parameters: GreenPlotter
STEP 5 Pre-processing input data: Pixel-based Architecture
STEP 6 Road Creating: A module for simulating road constructing
STEP 7 Land Partitioning: A module to divide the land into smaller parts
STEP 8 Site Selection: A module to suggest a site for constructing a building (ongoing project)
We tested the design process to see if it's possible to include eco-friendly elements when planning future cities.
Trees act as carbon sinks, they actively absorb carbon, offset greenhouse gas emissions in cities, combat climate change, and improve air quality.
- How it works?
Return CO2 into organic carbon compounds, through the photosynthesis process, Store carbon in trunks, branches, roots
A mature tree absorbs 48 pounds of CO2 per year.
- But how is it measured?
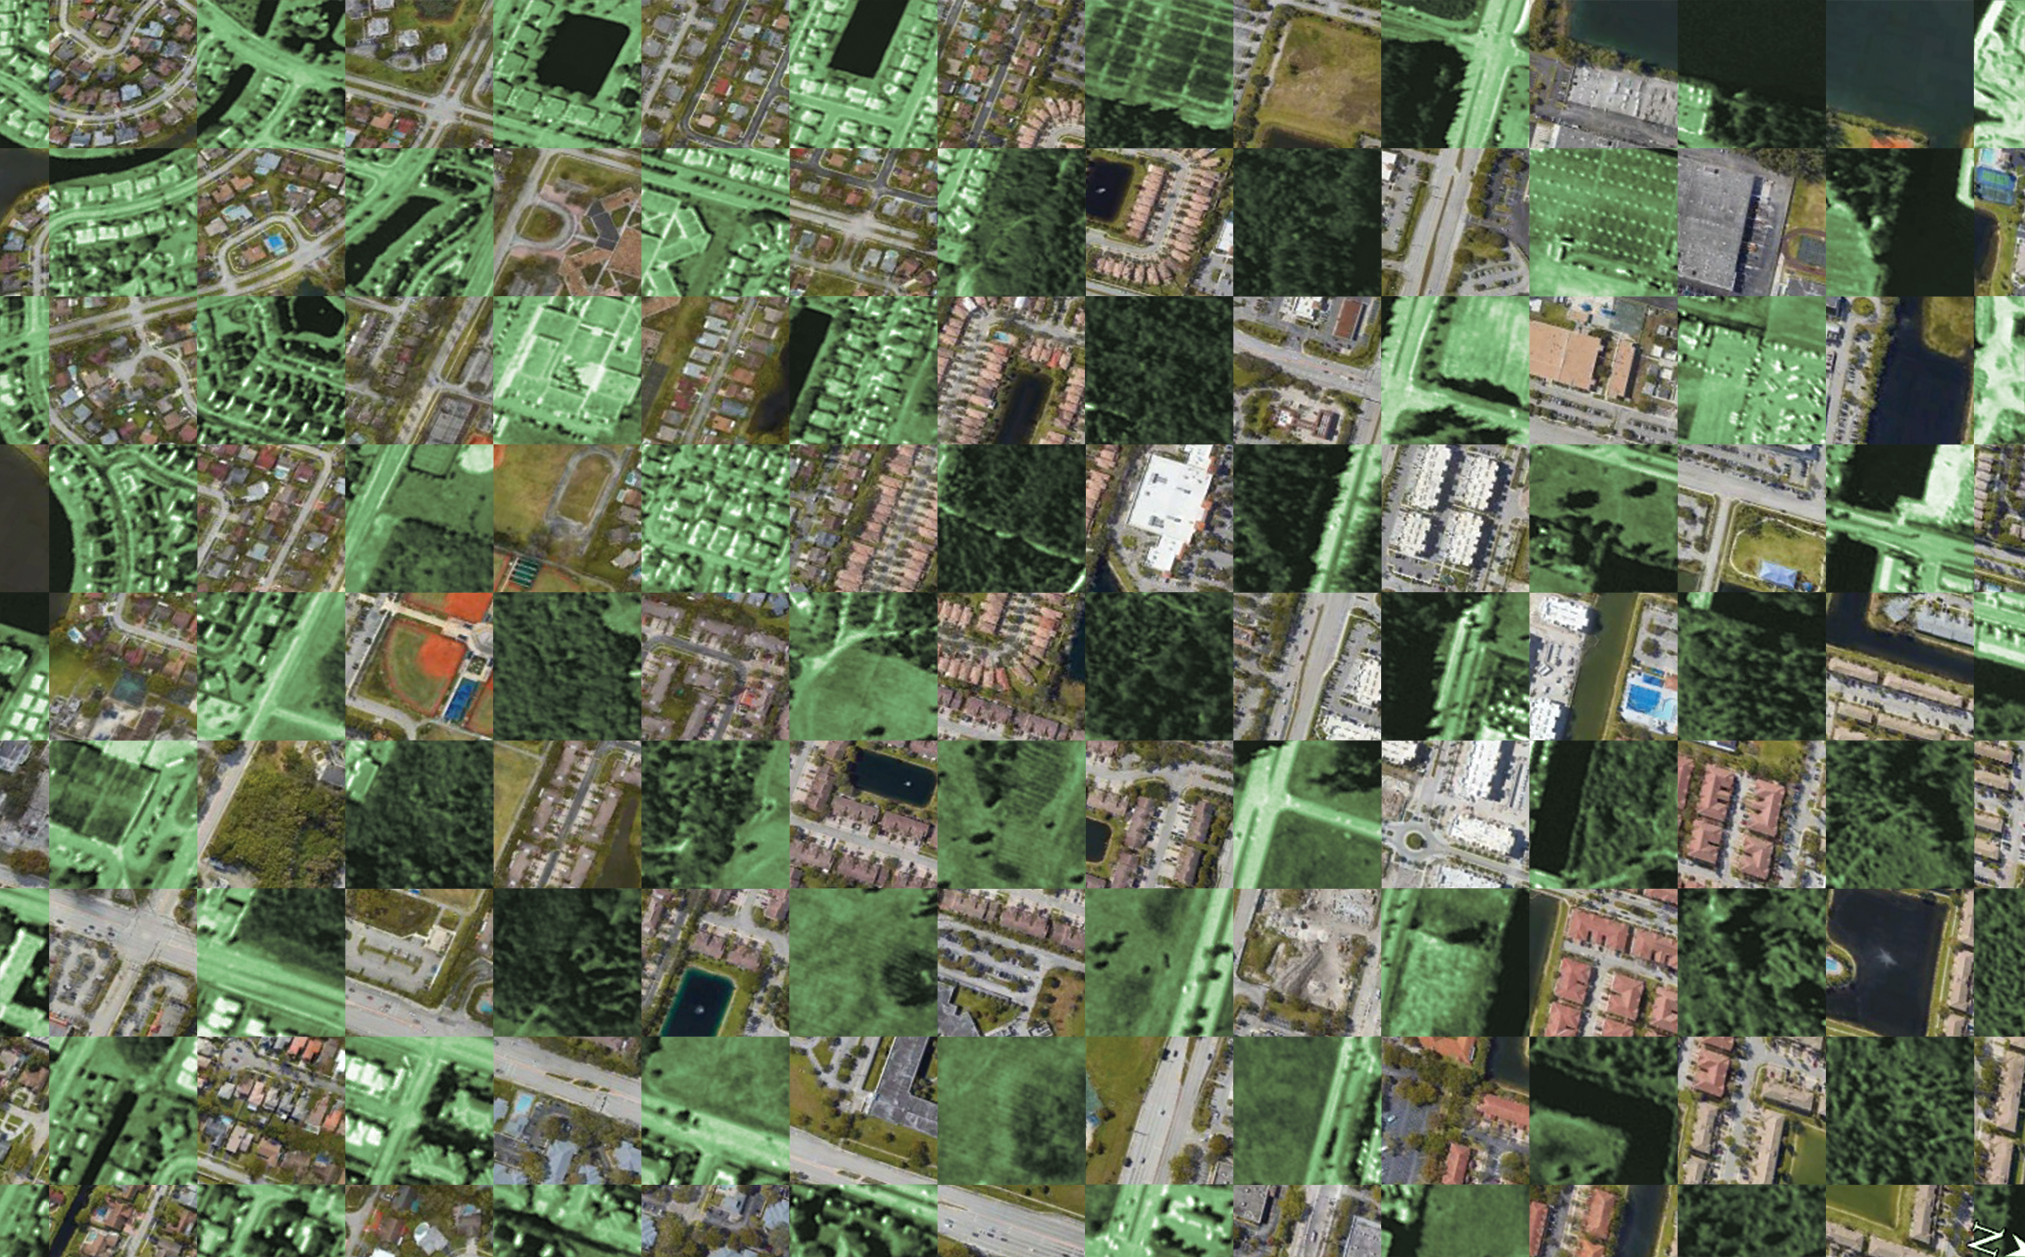
If we can answer this question, we will be able to create a carbon degree map from an existing map (like the one you see here). This map depicts the amount of carbon stored in each tree. To create this map, we need to understand the methods used, which depend on how carbon is stored in the environment. We won't go into too much detail here, but what's important is that making a carbon degree map is possible both in theory and in practice.
Carbon Degree Map
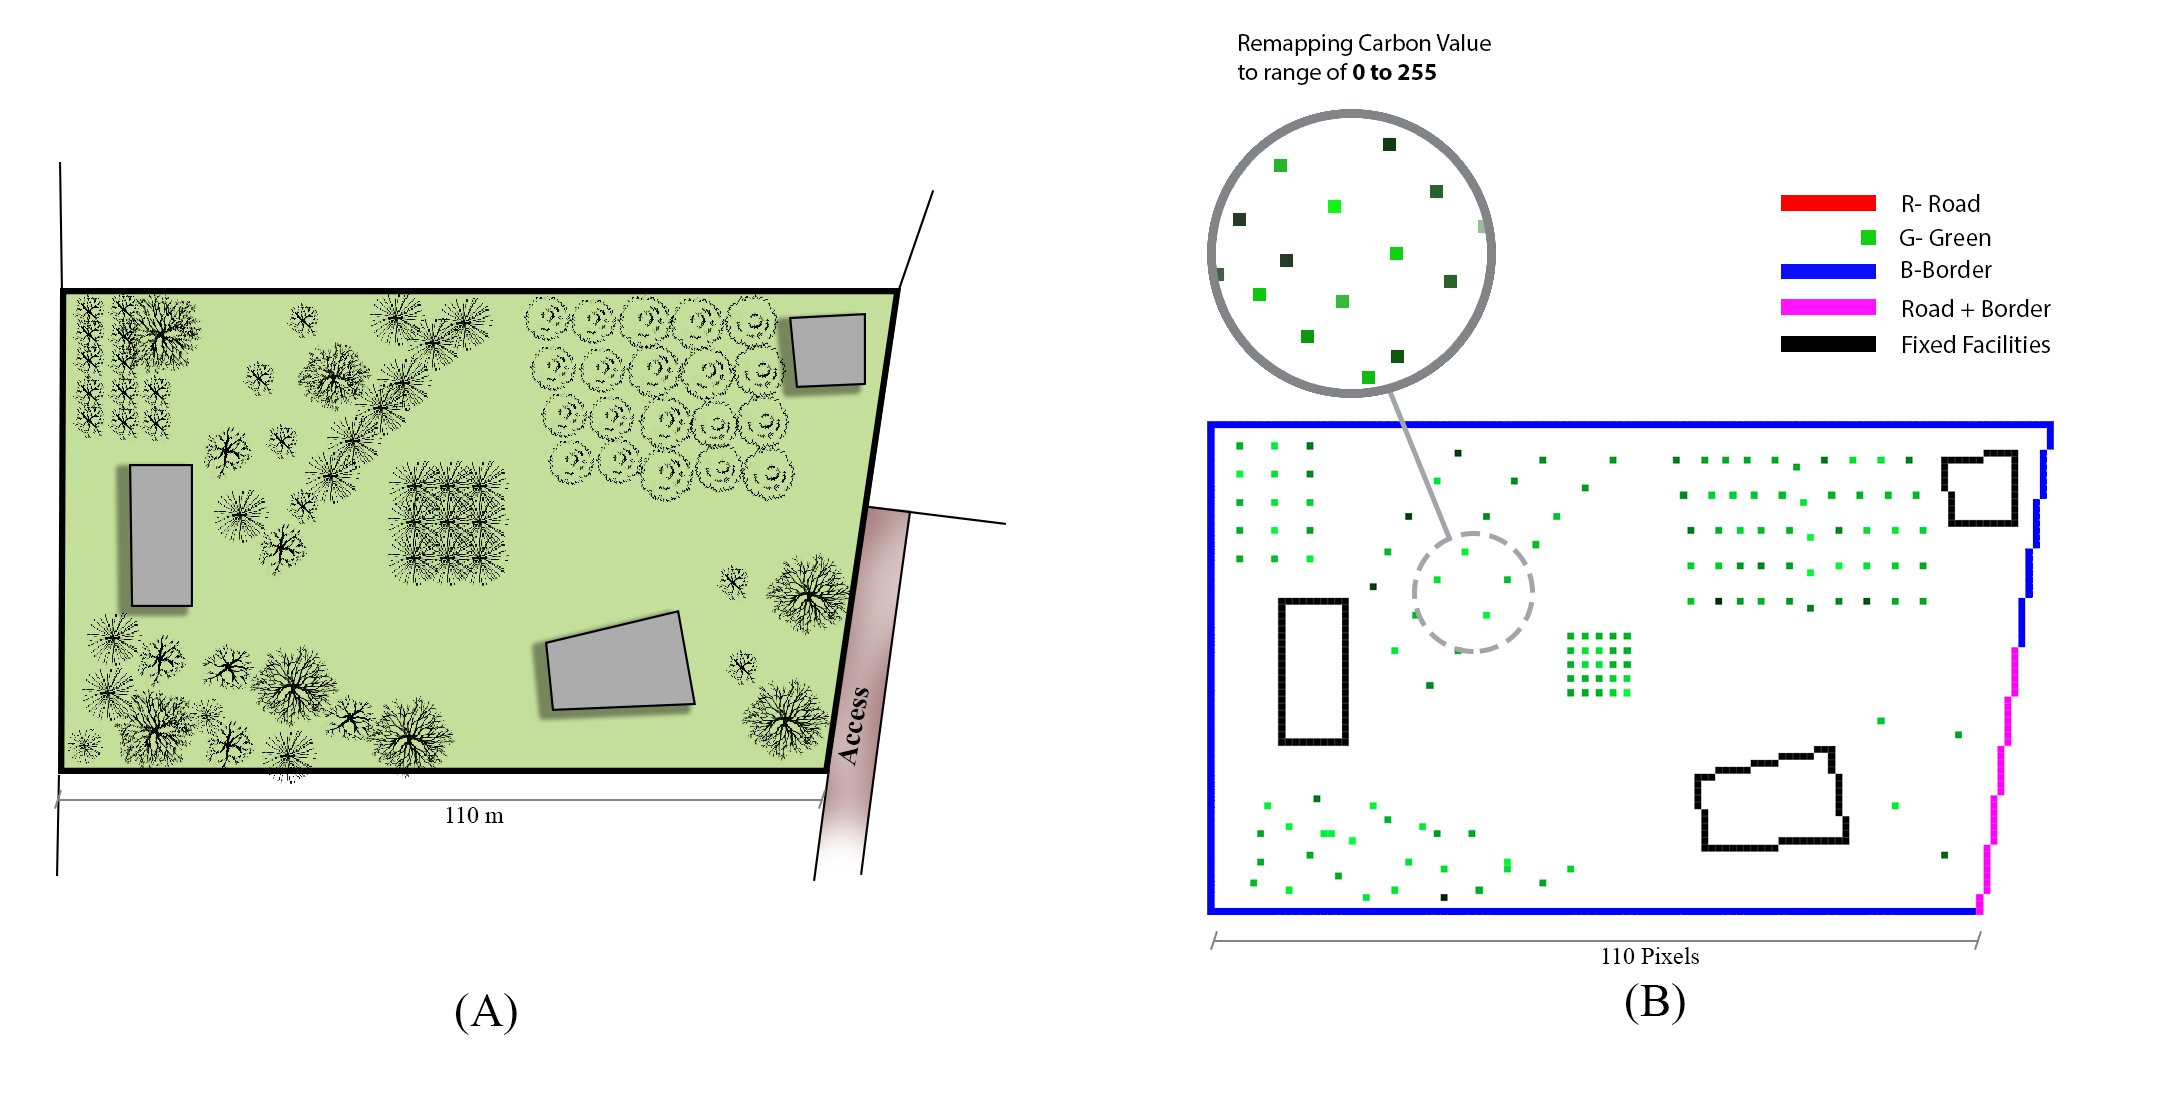
In the data preparation step, we transform the block map data into an informative RGB image. Each pixel in this image corresponds to one square meter in the real world, and we use integer RGB values to represent various objects, as indicated by the color code. Importantly, when dealing with the carbon values of trees, it's essential to remap them into the range of 0 to 255. Consequently, pixels with higher green integers signify more valuable trees in the context of our map.
Pixel-based Architecture
In the data preparation step, we transform the block map data into an informative RGB image. Each pixel in this image corresponds to one square meter in the real world, and we use integer RGB values to represent various objects, as indicated by the color code. Importantly, when dealing with the carbon values of trees, it's essential to remap them into the range of 0 to 255. Consequently, pixels with higher green integers signify more valuable trees in the context of our map.
Road Creation
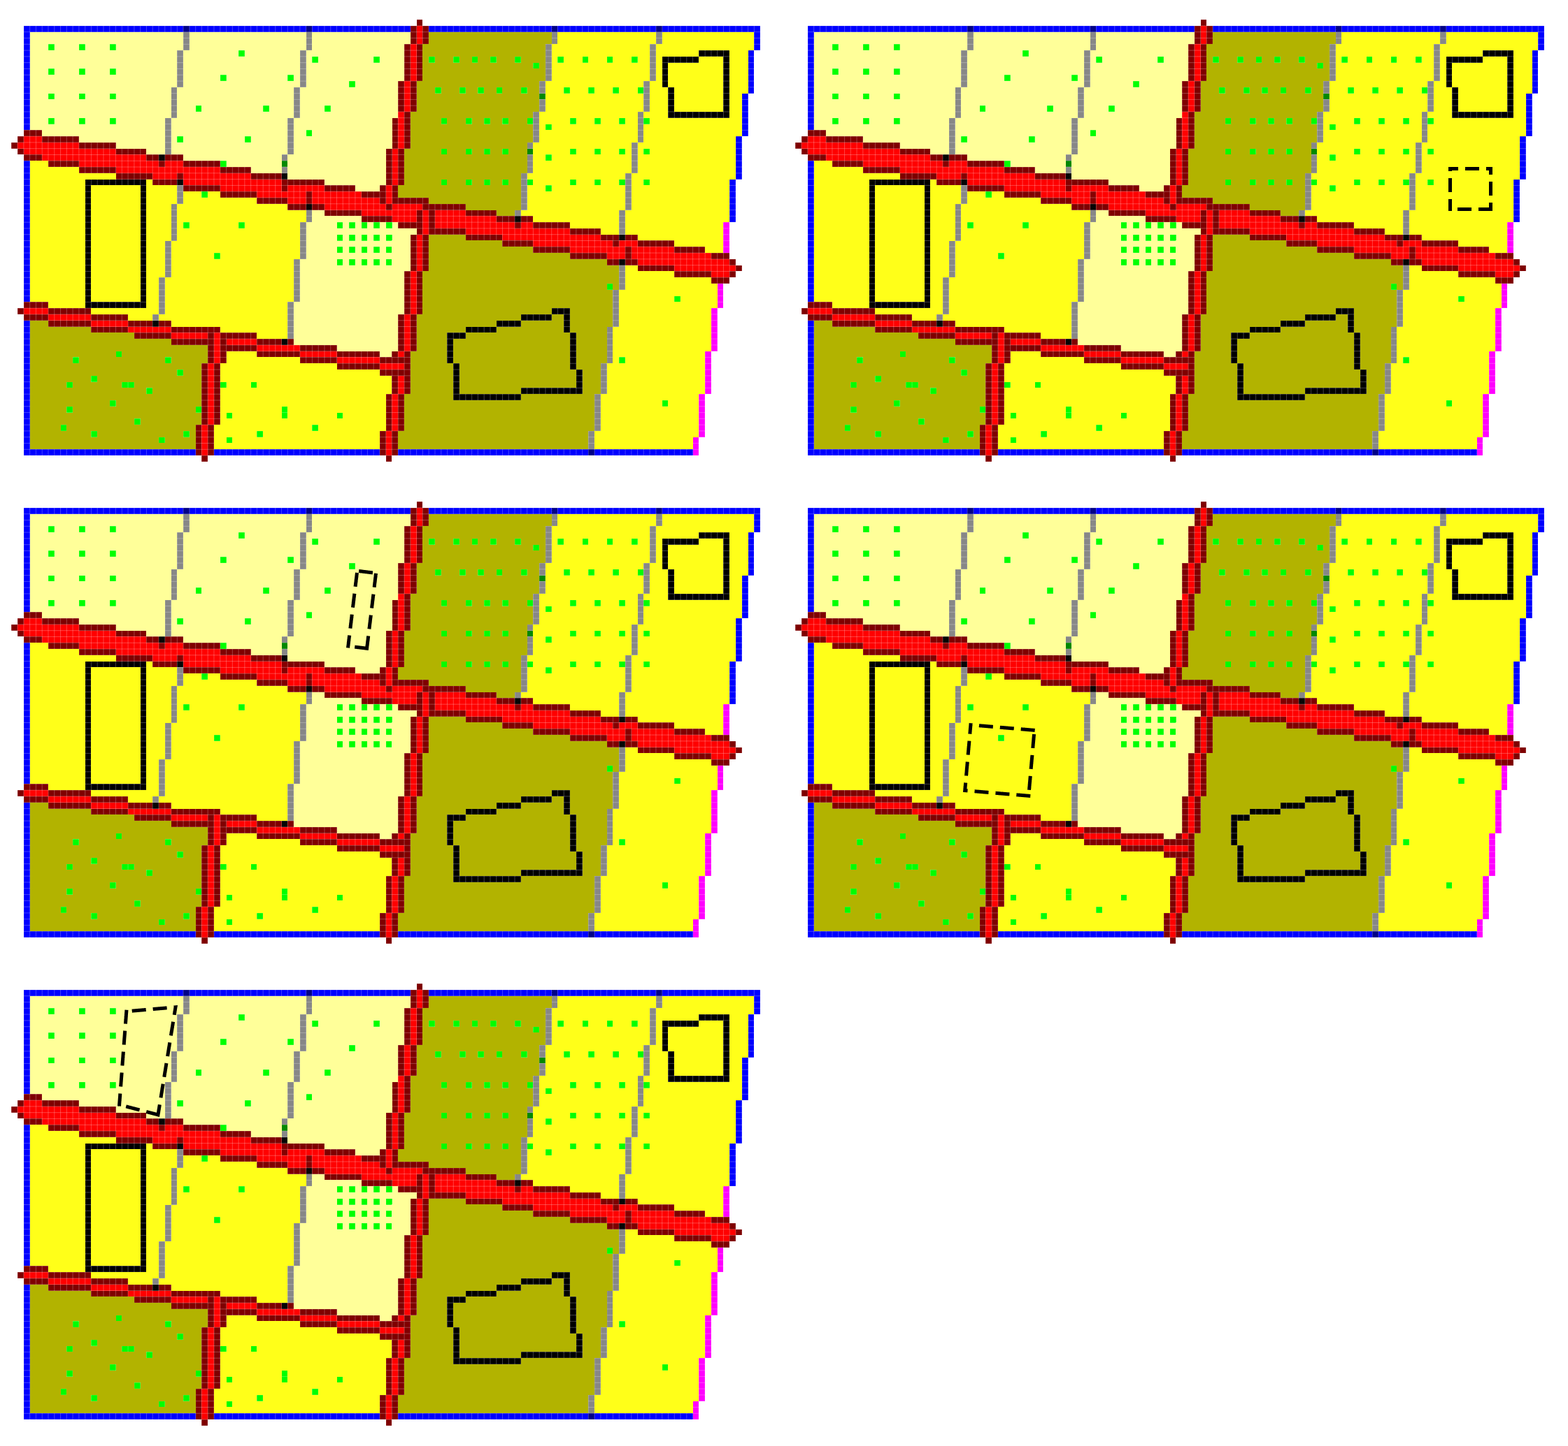
The first module, Road Creation, is responsible for determining access networks. Our approach to division follows an iterative process we've named 'Divide and Conquer,' drawing inspiration from computer science terminology. The rule is simple: it starts by dividing the input map into two smaller blocks and continues this process until further division is not possible. This module takes into account carbon, access, and size as parameters, utilizing a genetic algorithm to identify the most suitable lines to draw. By assigning a higher weight to the carbon parameter, we observe a reduction in road construction volume, indicating the effective operation of the low-carbon mode in the program.
Road Creation procedure
Land Partitioning
The second module, Land Partitioning, extends the process by subdividing the blocks into individual plots or parcels. Building on the output of the previous module, which consists of smaller-sized maps or blocks, this module slices them in the same direction into a defined range of sizes and categorizes them accordingly.
Land Partitioning procedure
Similar to the first module, we employ a genetic algorithm to determine the fittest division lines. Notably, the program's response to the low-carbon mode involves generating fewer parcels and preserving land in larger sizes. This approach reflects a conservative strategy aimed at minimizing the negative impact of urban development.
Site Selection
Lastly, we have the site selection module, currently an ongoing project. This module is designed to assist designers in choosing the optimal location within the plots, considering input parameters. In this phase, we are working on parameterizing variables such as topography, soil type, carbon parameters, and orientation toward the sun and wind. The project maintains a raster-based approach, requiring the translation of these parameters into an image language. Once this translation is complete, we'll be able to pinpoint the most optimum spots for placing our designed buildings.
Site selection procedure
Construction sites often lack a systematic approach to selecting, controlling, scheduling, and processing, which can lead to complications and challenges in the construction process. To address this issue, site investigation is conducted to gather specific information about the desired site, including its physical characteristics, topography, orientation, soil conditions, and environmental impact.
Site Selection Parameters
Orientation (Trees, Shade, Wind, Light and Energy)
Soil investigation (Urban soil, Site Class)
Climate
Topography/ Slope
Earthwork
Socio-economic parameters (Next step study)
In the hot months, things like concrete and bricks soak up a lot of heat during the day and release it at night, making the city stay warm. Shade trees, especially if they're not too far from buildings, can cover roofs and walls, keeping them cooler. Different types of trees have different effects, and some can save energy in houses during both hot and cold weather. Studies have shown that having the right kind of trees in the right places can cut heating costs by 10-20% and cooling costs by 30-100%.
slope is an important factor in most land planning decisions. Variations in slope and aspect influence the amount of solar radiation received by the site on a daily and seasonal basis. For example, in the Northern Hemisphere, north-facing, ten-degree slopes will receive less solar radiation than south-facing slopes of the same gradient. The north-facing slopes, when exposed to direct sunlight, receive less solar radiation per unit surface area than the south-facing slopes. Because the slope faces away from the sun, the solar radiation striking a north-facing slope hits the surface at a shallow, or acute, angle. Consequently, sunlight strikes the slope in a more diffuse pattern, delivering to the surface less solar energy per unit area (LaGro Jr et al., 2001).
Trees also act like natural wind barriers. They slow down the wind, and this affects how much energy buildings use to cool down. In summer, less wind means the heat from the sun stays on surfaces longer, making things hotter. So, having trees as windbreaks can impact how much heat buildings absorb, helping them use less energy for cooling. This shows that trees not only provide shade but also act as natural coolers for cities.
To read more about it see the below link:
https://doi.org/10.1080/24751448.2024.2405416
Gallery


